In order to manage Kubernetes clusters, your Catalyst Cloud user account
must be allocated the following roles in the project:
The Project Member (_member_) role, for viewing, creating and deleting
Kubernetes clusters using the Catalyst Cloud CLI or dashboard.
The Kubernetes Admin (k8s_admin) role, for granting
access to download the kubeconfig file, which is required to interact
with Kubernetes using the kubectl tool or the Kubernetes dashboard.
Note
User roles for Kubernetes RBAC are separate from the standard roles.
To interact with Kubernetes after your cluster is created,
even Project Admins need to grant themselves the appropriate roles.
For more information, please refer to the User Access section of our kuberenetes documentation.
A small quota is sufficient to deploy the development cluster template if your
project is empty. However, if you already have some resources allocated, you
may want to increase your quota to ensure there is sufficient capacity
available to deploy Kubernetes.
By default, Kubernetes templates allocate:
4 compute instances
8 vCPUs
16 GB of RAM
4 block storage volumes
40 GB of block storage space
3 security groups
1 load balancer
As a Project Admin you can change your quota using the Quota Management
panel in the dashboard, under the Management section.
This Quick Start guide for the most part involves using the Catalyst Cloud and Kubernetes
dashboards to perform tasks, but some specific steps require use of command line tools.
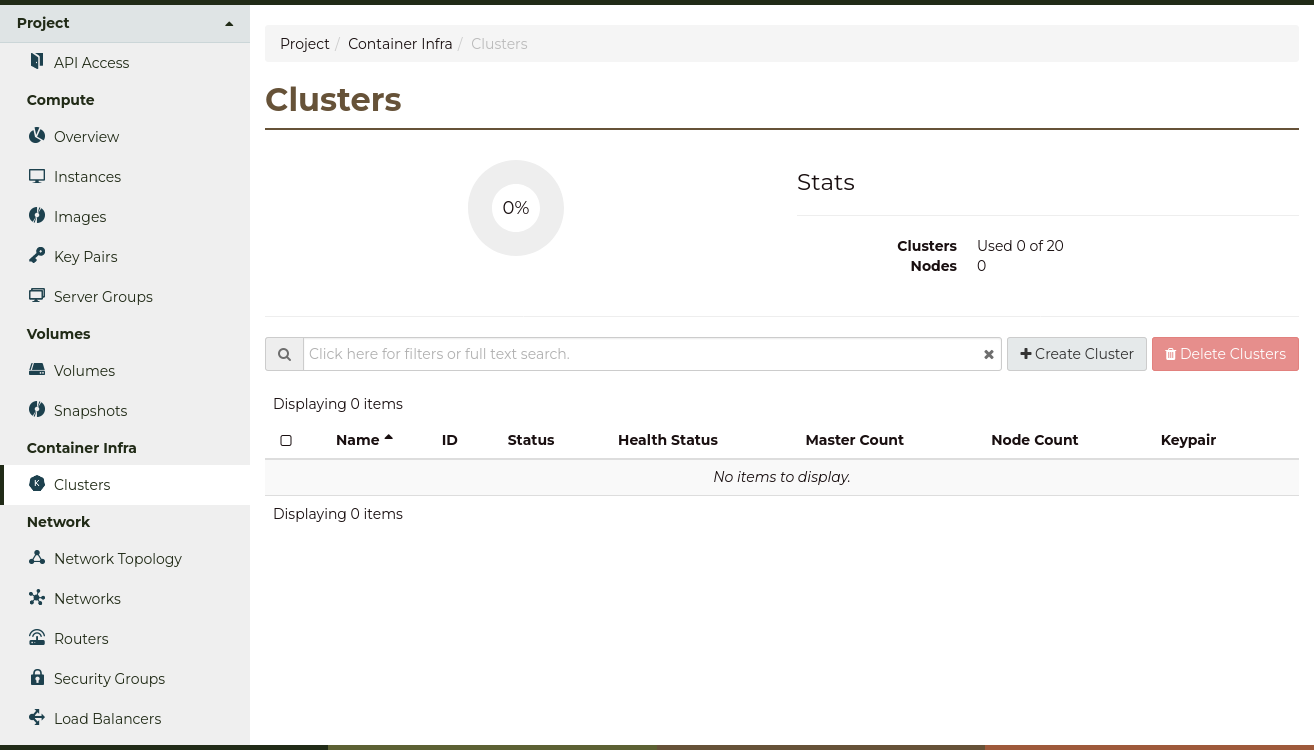
The Catalyst Cloud dashboard allows you to create, manage and monitor
the current status of your clusters.
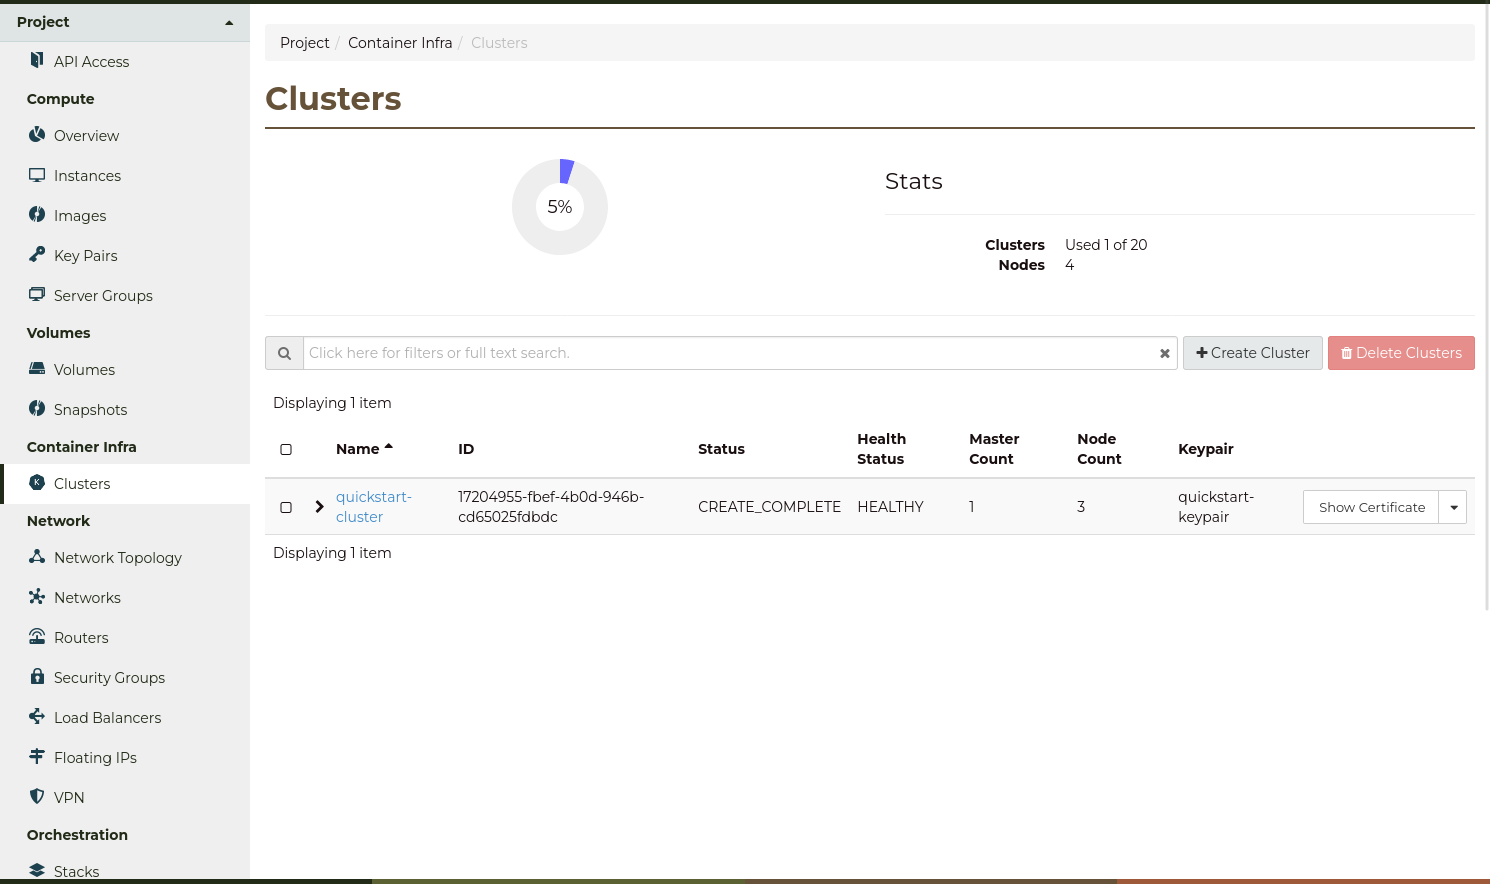
From the Clusters page under the Container Infra tab, you
will see the following:
This page gives you an overview of your clusters, their status and how many
clusters you have, measured against your quota.
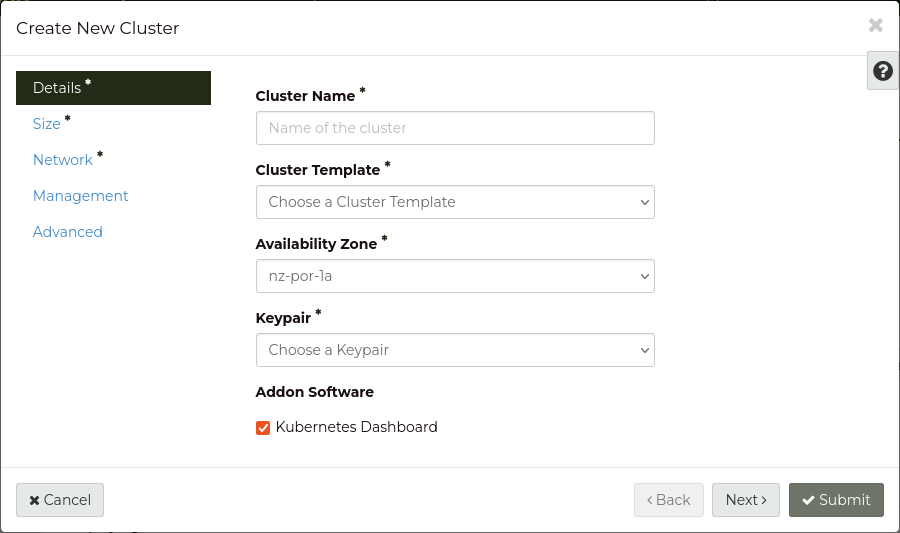
To create a new cluster, click the + Create Cluster button:
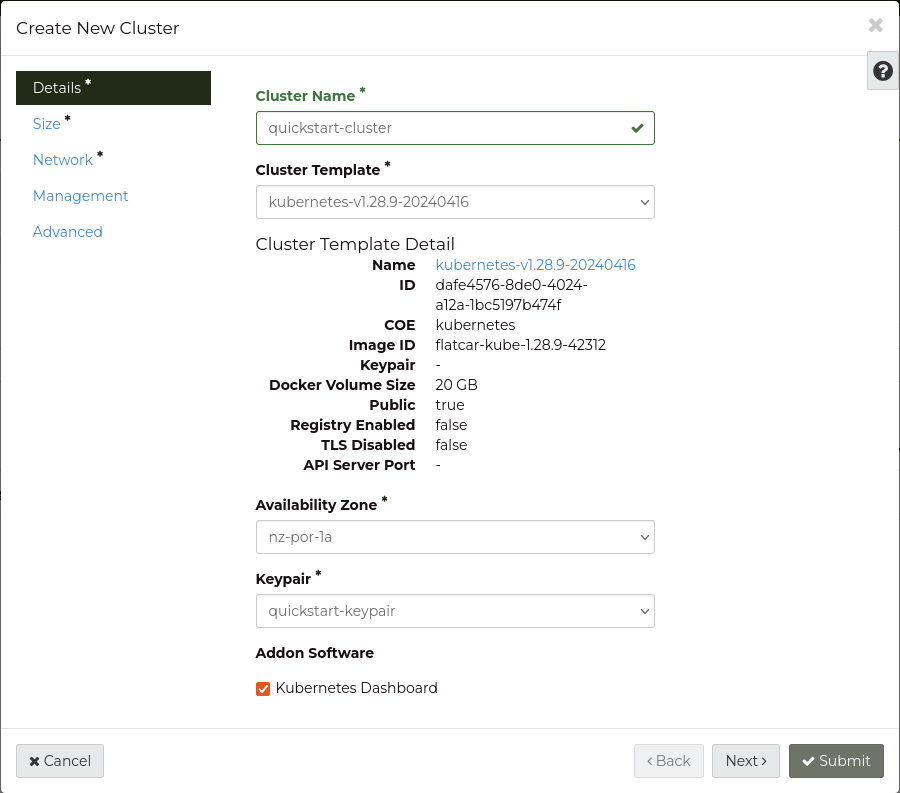
Pick a Name for your new cluster, and choose the
latest Cluster Template version available from the drop-down list.
Once that is done your screen should look something like this:
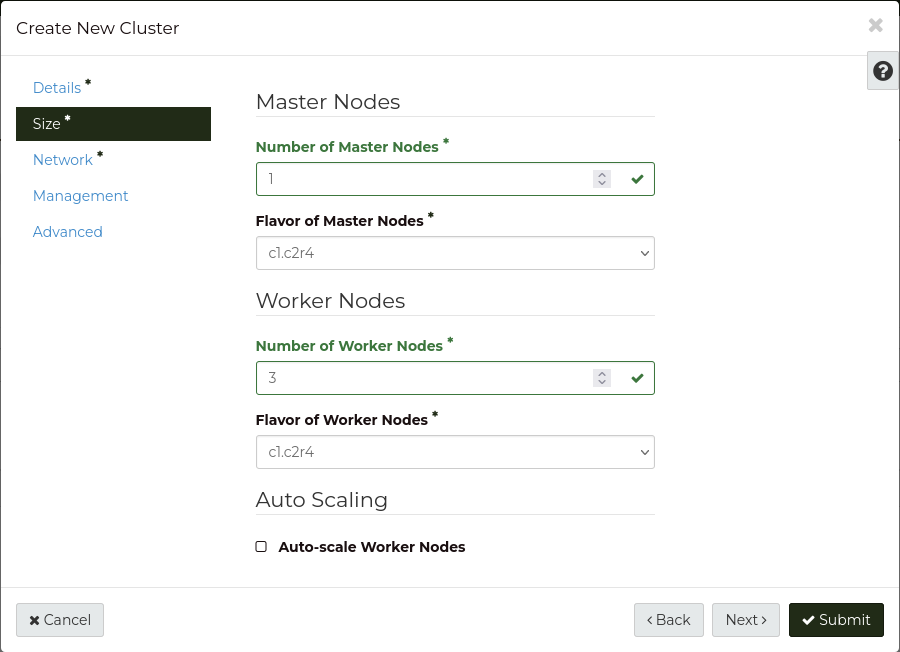
Next, select the Size tab to configure the size and number of nodes in the cluster.
There are two types of nodes in Catalyst Cloud Kubernetes clusters:
Control Plane Nodes (formerly referred to as Master Nodes), and Worker Nodes.
Control Plane Nodes are where the Kubernetes control plane is hosted,
and Worker Nodes run the container deployments uploaded to Kubernetes.
You may create any number of Worker Nodes, however Control Plane Nodes
must be created with an uneven number e.g. 1, 3 or 5.
In the example below, the cluster will be created with 1 Control Plane Node and 3 Worker Nodes.
The flavors of the Control Plane Nodes and Worker Nodes
can also be configured individually. For this guide we will use the default values.
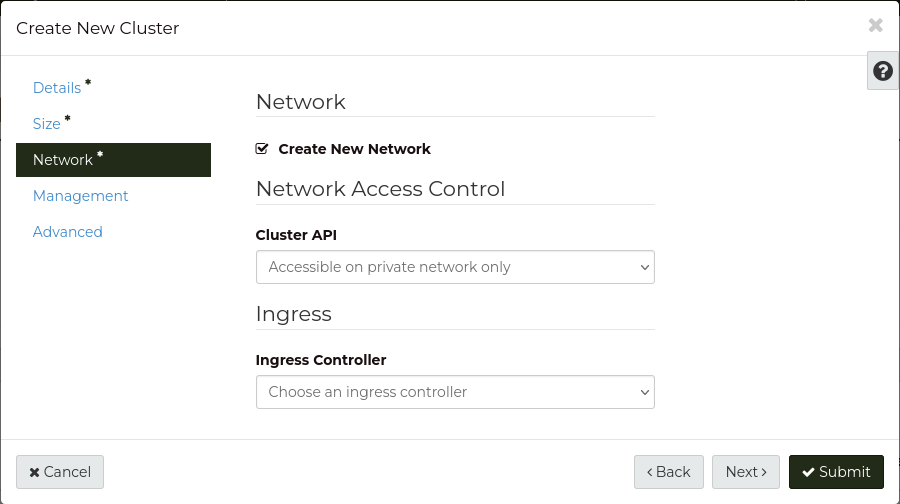
Select the Network tab to configure the cluster’s network access.
To enable access to the Kubernetes API from the public Internet, select
‘Accessible with public floating IP’ from the Floating IP drop-down list.
For this guide, we will leave the Allowed CIDRs field empty.
That is everything you need to configure for this guide,
so press the Submit button to create the cluster.
You will be returned to the Clusters page, where you can monitor the state
of your Kubernetes clusters. Our new cluster should be listed,
in CREATE_IN_PROGRESS state. Refresh the page periodically to see the updated cluster status.
Creating a new Kubernetes cluster can take up to 20 minutes,
depending on the size of the cluster you are trying to build.
Once the cluster has reached the CREATE_COMPLETE state, it is now up and running,
and you can start using it.
You can now download the kubeconfig file for the cluster using the Download Kubeconfig button.
The kubectl tool allows you
to interact with your Catalyst Cloud Kubernetes cluster using the command line.
As the Kubernetes dashboard of our cluster is not directly accessible from the Internet,
we will use kubectl to gain access to the Kubernetes dashboard.
First, ensure you have downloaded the kubeconfig file from the Catalyst Cloud
dashboard using the Download Kubeconfig button.
Note
Your browser may download the kubeconfig file to another location.
If you wish to download the kubeconfig file to a specific location
(and not the default location for your operating system), replace .../Downloads
in the below file paths with your desired download location.
The kubeconfig file contains the required metadata used to authenticate
with the Kubernetes cluster.
In a command line terminal environment (such as bash) export the KUBECONFIG
environment variable, to configure kubectl to connect to your cluster.
Alternatively, if you have no other Kubernetes clusters, you could move the downloaded file
(quickstart1_kubeconfig) to the default location for kubectl, in $HOME/.kube/config.
The kubeconfig file uses the Catalyst Cloud authentication token in your terminal’s environment
(provided by the OpenRC file) to authenticate with the Kubernetes API.
To be able to use kubectl, your OpenRC file for the project must be sourced,
and the KUBECONFIG environment variable must be defined.
Once we have the CLI configured, we can then begin to use kubectl to interact with the
cluster.
To test everything works, run the kubectlcluster-info command to
show the details of the cluster:
$ kubectlcluster-info
Kubernetes control plane is running at https://192.0.2.1:6443CoreDNS is running at https://192.0.2.1:6443/api/v1/namespaces/kube-system/services/kube-dns:dns/proxyTo further debug and diagnose cluster problems, use 'kubectl cluster-info dump'.
Now that we have kubectl available, we can access the Kubernetes dashboard.
In the currently open terminal (with your OpenRC file sourced), run the following command
to fetch the authentication token from the environment, and copy it to the clipboard.
We will use this once the dashboard is open.
echo$OS_TOKEN
In the currently open terminal (with your OpenRC file sourced), run the following command
to fetch the authentication token from the environment, and copy it to the clipboard.
We will use this once the dashboard is open.
echo $Env:OS_TOKEN
In the currently open terminal (with your OpenRC file sourced), run the following command
to fetch the authentication token from the environment, and copy it to the clipboard.
We will use this once the dashboard is open.
echo%OS_TOKEN%
Now run the following command in the same terminal window:
kubectlproxy
This starts a proxy session which allows you to access the dashboard.
$ kubectlproxy
Starting to serve on 127.0.0.1:8001
Once the proxy is running, open the following URL in your browser:
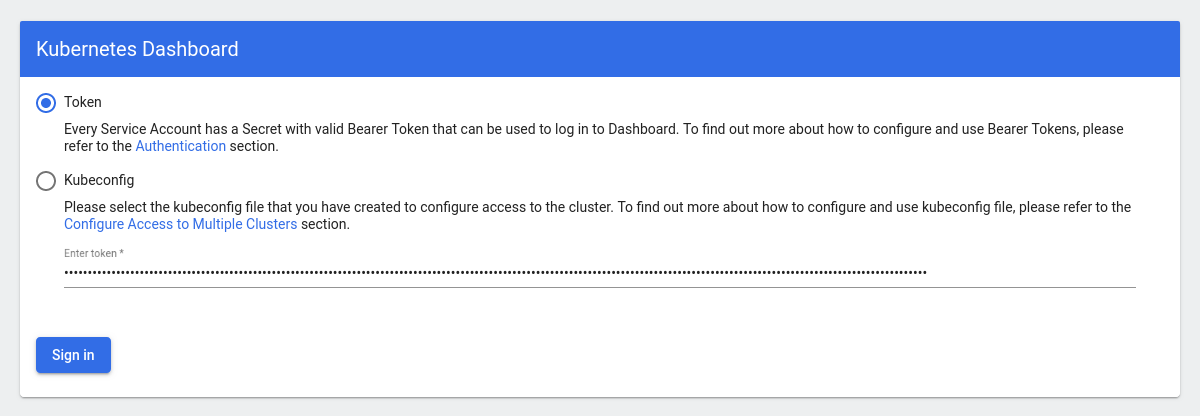
You will be presented with a login screen, as shown below. Select
Token as the authentication type and paste in the authentication token
acquired in the previous steps.
Press Sign in to login, and you should now have the Kubernetes dashboard open in your browser.
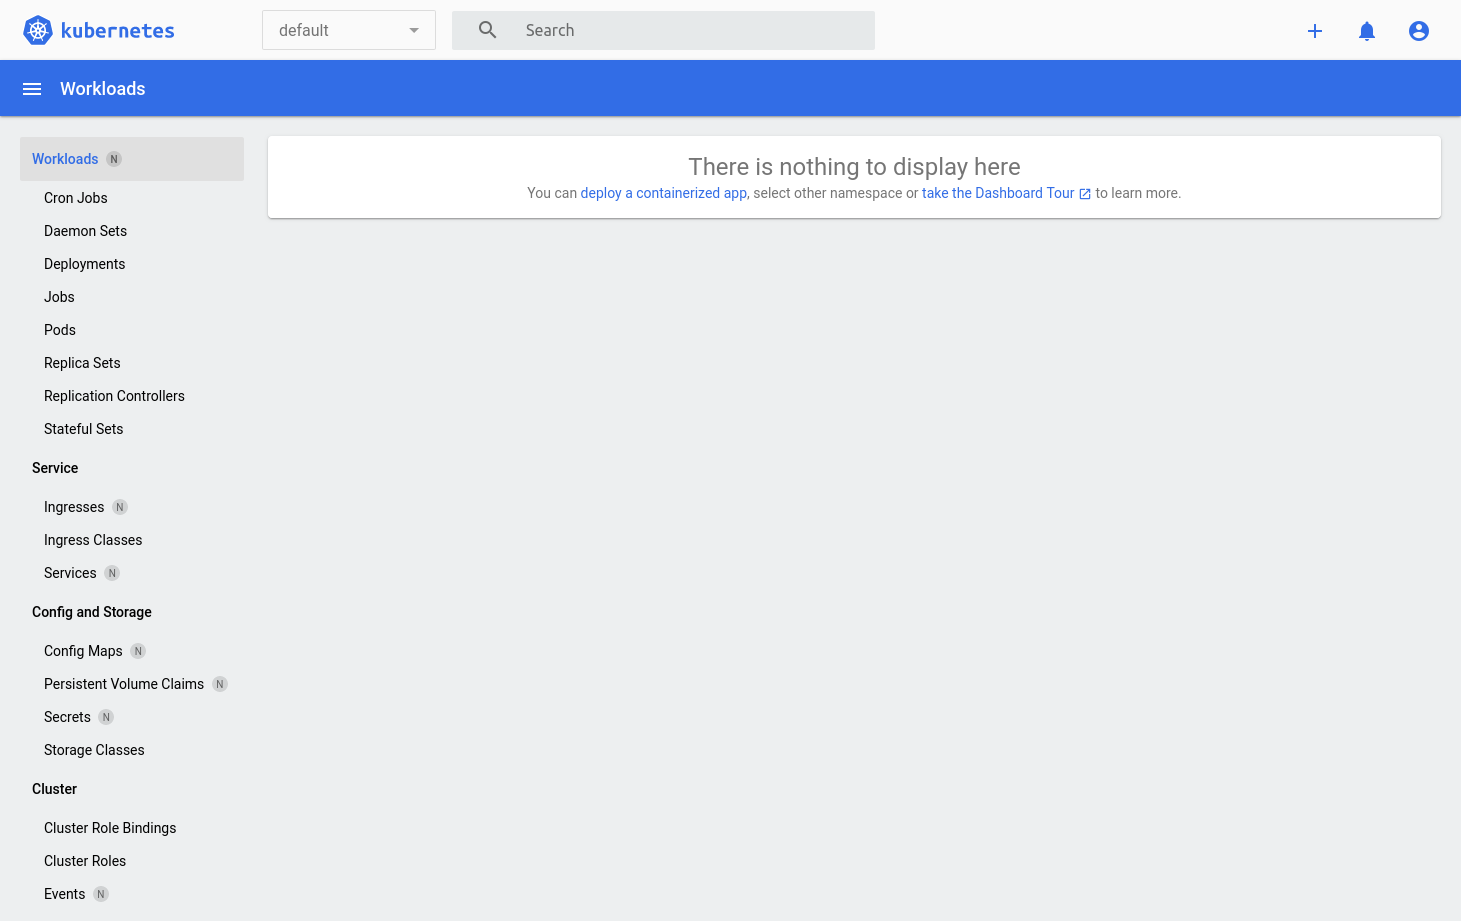
Let’s try creating a deployment for a basic application on Kubernetes.
First, click the + button in the top right of the dashboard
to open the Create new resource form.
Select Create from input, and paste the following YAML into the form.
This YAML creates a new deployment called quickstart-nginx,
which consists of a single nginx web server, serving the default test page via HTTP (port 80).
You will now directed back to the home page, where the new deployment
will be tracked in real time:
Let’s check that our new application is working properly.
This application is not accessible from the Internet, so we will need to
create a port forward from the local machine to the application in the cluster.
Since the terminal window we have been using is currently running the
kubectlproxy command for the Kubernetes dashboard,
open a new terminal window.
Make sure to source your OpenRC file, and set the KUBECONFIG
environment variable (as shown in Configuring kubectl).
Then, run the following command to create the port forward to the application: